We will assume here that you have downloaded your data into the software you are using the instructions applicable to that software. We will also assume that you have taken the individual grids and applied the layout of those grids in the software to produce a composite image. Now comes the fun part, applying the various filters to produce a nice image and interpreting the results, assuming the software you are using comes with these filters.
Now you have a basic image to work with, you need to look at it to see what filters will help. I will cover here the most basic filters, which you will use most. Your software may have other filters which may be of limited use, but you will need to consult the documentation that comes with your software for those. Not all filters are useful in all situations, and it is worth remembering that filters should be used in a certain order for the best results.
Most images will have some 'noise' which is not applicable to the features you are trying to identify. In resistivity, you may have hit a stone and recorded a very high resistance reading. In magnetometry, there may have been a part off a tractor buried in the field causing a magnetic spike. By noise, we specifically mean a single high or low spike within an area of otherwise average readings. Whatever the reason for this noise, it can skew the results of other filters because of the extreme readings involved. So before you apply any other filters, it is worth using the Despike filter to remove these.
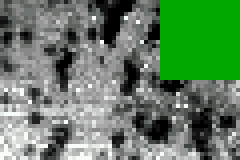 Before Despike |
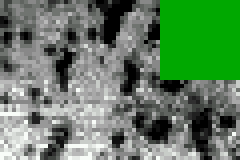 After Despike |
Next for resistivity, after the Despike, you should now be looking at the edges of the individual grid squares. If you can see where one grid finishes and another starts by a distinct difference in the readings between the two squares, this needs correcting. In resistivity, this is usually caused by the fixed probes being moved. Your software will have a tool to match these grids so one should flow seamlessly into the other. In Geoplot, this is called 'Zero Mean Grid', in Snuffler, it is called 'Edge Correction'.
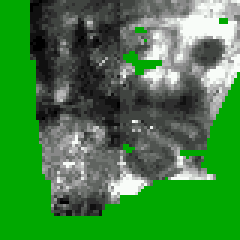 Before Edge Correction |
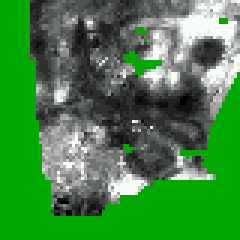 After Edge Correction |
Continuing with resistivity, you should now have an image which is free of artifacts caused by the survey process. You may be able to see some features, but there are ways of making them clearer. The local geology may play a significant role in your image. If these are small features such as solution hollows or cracks in the bedrock, i.e. high frequency features, then you are stuck with these as the features you are looking for are also high frequency. If on the other hand, you have a slow change in the depth of the topsoil across the site, causing a slow but visually significant change in the readings, then there is a filter called a 'high pass filter', or 'Remove Geology' in Snuffler which can help. This filter removes these slow changes and flattens out the site, making the 'high frequency' archaeological features easier to see. You are usually asked to supply a sample size. The filter works by taking an average of the readings around each reading to calculate a background. If you take a large number of readings for the average, then the background will change less and there will be less flattening of the image. If you take a small number of readings, the background will change more and you may start to loose the features you are looking for. You should try several sample sizes to get the right one.
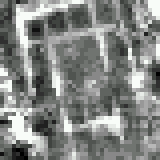
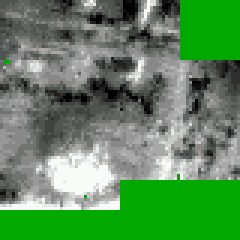 Before High Pass Filtering |
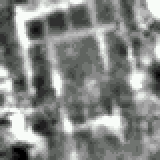
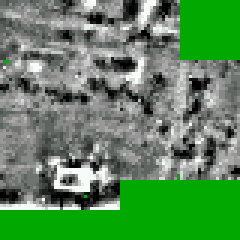 After High Pass Filtering |
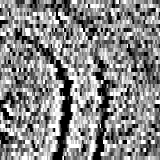
Moving on to filters specific to magnetometry. The setup of fluxgate gradiometers, and thei directional nature, will produce a stripy effect across your surveys. This can be removed with a destripe feature. Particularly strong signals may cause this filter to leave, or even produce stripes in places. Destriping per sensor/direction may help here, which takes a wider average rather than just dealing with each line one at a time.
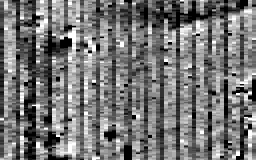 Before Destriping |
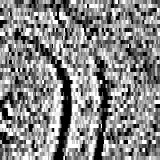
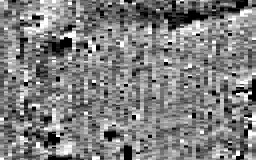 After Destriping |
The next useful magnetometry filter is destagger. The machine operator may consistantly misjudge the position on the grid by a small margin, or walking on a slope might make it difficult to walk at a steady pace. The result can be a staggered effect on linear features. The destagger filter can correct these sort of errors.
 Before Destaggering |
 After Destaggering |
The last feature to be used, for both resistivity and megnetometry, and it must always be the last, is the interpolation filter. Interpolation will increase the number of readings and guess what is in between, thereby smoothing out the image and making it easier on the eye. Whilst it doesn't provide any more literal information in the image, it takes advantage of the way the eye and brain work in processing information to help you see the features instead of concentrating on the differences between individual readings.
 Before Interpolation |
 After Interpolation |
Now you have a nice image, you can try and work out what archaeological features are visible. They may not be obvious straight away, prolonged consideration of the image may be needed, especially if the area covered is quite large. Comparison with an aerial photograph is useful as the two can provide complementary information. The process is best done by viewing the image on a screen rather than a sheet of paper as the colour reproduction is usually better on a screen. Also, get many people to look at the image, as other people can often spot things that you miss. Other than that, recognising features is not something you can explain on a web page, you just have to get experience by looking at many images to be able to distinguish between the archaeology and your local geology.